SWO
SWO support is limited and may not work with all targets. RTT is recommended as a more reliable alternative for most use cases. SWO is currently not supported in CLI mode
Overview
SWO (Single Wire Output) uses the ITM (Instrumentation Trace Macrocell) and TPIU (Trace Port Interface Unit) peripherals built into Cortex-M3, M4, and M7 to output trace data over a dedicated SWO pin on the debug connector.
Customizations
We try to initialize SWO from the outside with GDB commands. But if the adderess don't match your Silicon it may not work. Clocking topoloties also may not be standard. There may be other HW that needs to be inilized besides the standard ARM ones. In the installation directory ~/.vscode/extensions/mcu-debug.mcu-debug.#.#.#/support directory there is a gdbsupport.init file. You can copy and modify this file and added add it to launch.json the preLaunchCommands. It will override existing definitions.
"preLaunchCommands": [
  "source \"mygdbsupport.init\""
]
Doing the SWO setup in firmware is another alternative.
Limitations
Before choosing SWO, consider these limitations:
- Requires SWO pin exposure: the debug connector must expose the SWO pin. Many PCBs omit this pin even when the MCU supports SWO. Many USB debug probes do not expose SWO even when the connector has it.
- Requires correct CPU clock setup: the SWD/SWO divider must be configured with the exact CPU clock frequency at session start. If the firmware changes the clock (e.g. PLL setup in
SystemInit), SWO output may become garbled. - Vendor-specific peripheral map: slight differences in ITM/TPIU memory map across vendors can prevent correct automatic setup.
- Not supported on Cortex-M0/M0+: these cores do not have ITM/TPIU.
- Not compatible with multi-core configurations: SWO is a single global channel.
When to Use RTT Instead
RTT is strongly preferred for new projects:
| RTT | SWO | |
|---|---|---|
| Extra pins | None | SWO pin |
| Cortex-M0/M0+ | Yes | No |
| Multi-core | Yes | No |
| Throughput | High | Low |
| Clock dependency | None | Yes |
| Probe support | All | Probe and PCB dependent |
Basic SWO Output Configuration
Simple SWO ascii console, CPU running at 72MHz, SWO at 2MHz, SWO data comes from probe itself (eg. ST-LINK)
"swoConfig": {
    "enabled":true,
    "source":"probe",
    "swoFrequency": 2000000,
    "cpuFrequency":72000000,
    "decoders": [
        {
            "port": 0,
            "type": "console",
            "label": "SWO output",
            "encoding":"ascii"
        }
    ]
}
Depending on the gdb-server (OpenOCD, JLink, etc.) the source can be different. The source is the method to acquire SWO data from the gdb-server. SWO data may be served using a 'probe', 'socket' (tcp), 'file', 'fifo', 'serial' (serial-port), etc. file based methods are unreliable, so a fifo is used on Unix/Mac. Where available a socket is always the preferred method. Following are the currently supported source types and how they are interpreted.
| Server | SWO input methods supported |
|---|---|
| OpenOCD | probe/file/socket use a tcp port. serial also supported |
| pyocd | probe/file/socket use a tcp port. serial also supported |
| stutil | serial |
| external | probe implies a file (windows) and a FIFO on other platforms. |
file, socket and serial also supported with their intended meaning |
MCU-Debug will auto-configure the server as required, but you can provide overrides. With an external server, where a server is launched outside of this extension, all configuration has to be done manually (via overrides)
SWO is only useful if you have one or more decoders. A decoder tells this extension how to handle the data stream from SWO. Since SWO supports multiple ports, you can have each port go to a decoder. Following decoder types are available:
| Decoder type | Handling of the data |
|---|---|
console | Data is interpreted as human-readable text with a given encoding ('utf8' is the default). You can find the output in the TERMINAL tab. |
binary | This is similar to console but data is interpreted as a binary stream like signed, unsigned, float, etc., and the result is displayed as hex values. Each line in the output window will contain a timestamp hex-value - decoded-value - scaled-value |
graph | This is also interpreted as binary data but is useful for plotting graphs. Each such decoder has a graphId (arbitrary user-defined name) that can be later used in a graph. See Output Graphing |
advanced | This is where you provide a custom JavaScript module to interpret the data. For each chunk of data received, an event is generated that your module can subscribe to. See source code here |
SWO configuration
To get SWO working, several registers in the device have to be set to specific values. This is done with a combination of gdb commands and help with the gdb-server (OpenOCD, etc.). Rarely, you may have to add some initialization code in your FW because of how your MCU is designed. There are two aspects to getting SWO working
- GDB setup. Setup the ARM CoreSight components by writing to the appropriate registers. Cortex-Debug will attempt to do this. But it may not succeed.
- Cortex-Debug does not know anything about your specific to initialize the clocks and IOs. You can do this externally by writing to the appropriate registers or from within your firmware
- The ARM trace components (TPIU, DWT, ITM) for your device may not use the default base addresses. This will cause the gdb scripts to not do the right thing. You can override the default scripts with your own as long as the name of the GDB macro (SWO_Init) is the same. You can add any device-specific settings here as well. You can find this script at https://github.com/mcu-debug/mcu-debug/blob/main/packages/mcu-debug/support/gdb-swo.init. You can make a copy and use it like this
        "preLaunchCommands": [
            "source ${workspaceFolder}/mygdbscript.txt"
        ]
- GDB-server setup: OpenOCD requires a bit of configuration. Because each vendor provides the OpenOCD set up a little bit differently, the default script we run may also fail. This occurs before we do any GDB setup. If you need to customize this, you can make a copy of the file/function https://github.com/mcu-debug/mcu-debug/blob/main/packages/mcu-debug/support/openocd-helpers.tcl and add it as the first item in the
configFilesproperty. Note that this file only defines functions and does not call them. Cortex-Debug will call theCDSWOConfigureTCL function with the appropriate parameters at the appropriate time.
ARM basic config
This example expects CMSIS usage
Init (ST specific, Obsolete?)
/* Select the SWO interface */
DBGMCU->CR &= DBGMCU_CR_TRACE_MODE_Msk;

/* Enable the TRACE interface */
DBGMCU->CR |= DBGMCU_CR_TRACE_IOEN;
Above is not needed if the gdb-script is initializing the SWO registers. You can also look at a C implementation at https://github.com/mcu-debug/mcu-debug/blob/main/packages/mcu-debug/support/swo-init.c and not use the GDB script.
Send character
ITM_SendChar(character);
Note: Don't forget to properly configure SWO pin. Some devices may have a clock that controls the TPIU that needs to be configured
Advanced Decoder Creation
We don't have any real documentation. But here are some contributions from users (should work for both RTT and SWO)
https://github.com/Marus/cortex-debug/issues/104#issuecomment-1450108082
Output Graphing
Example of a time series graph with two lines
"graphConfig" can be used alongside with "swoConfig" or with "rttConfig". It may also work with a combination of the two as long as the graphIds are unique. See also https://mcu-debug.github.io/mcu-debug/docs/tracing/builtin-rtt
VSCode MCU Debug configuration
{
  "type": "mcu-debug",
  "request": "attach",
  "servertype": "openocd",
  "cwd": "${workspaceRoot}/build",
  "executable": "NucleoProject.elf",
  "name": "Debug (OpenOCD)",
  "device": "STM32F303",
  "configFiles": [
    "board/st_nucleo_f3.cfg"
  ],
  "swoConfig": {
    "enabled": true,
    "decoders": [
      {
        "type": "graph",
        "port": 0,
        "encoding": "unsigned",
        "graphId": "1",
        "scale": 1
      },
      {
        "type": "graph",
        "port": 1,
        "encoding": "unsigned",
        "graphId": "2",
        "scale": 1
      },
    ],
    "cpuFrequency": 75000000,
    "swoFrequency":  2000000,
    "source": "probe",
  },
  "graphConfig": [
    {
      "label": "Graph 1",
      "timespan": 5,
      "type": "realtime",
      "annotate": false,
      "maximum": 256,
      "minimum": 0,
      "plots": [
        {
          "graphId": "1",
          "label": "data 1",
          "color": "#53753c"
        },
        {
          "graphId": "2",
          "label": "data 2",
          "color": "#955f20"
        }
      ]
    },
  ]
},
Modified ITM_SendChar (CMSIS) function (added ITM port)
uint8_t ITM_SendChar(uint8_t ch, size_t const port)
{
  if (((ITM->TCR & ITM_TCR_ITMENA_Msk) != 0UL) &&      /* ITM enabled */
      ((ITM->TER & (port+1)          ) != 0UL)   )     /* ITM Port enabled */
  {
    while (ITM->PORT[port].u32 == 0UL)
    {
      __NOP();
    }
    ITM->PORT[port].u8 = (uint8_t)ch;
   }
  return (ch);
}
VSCode MCU Debug output graph
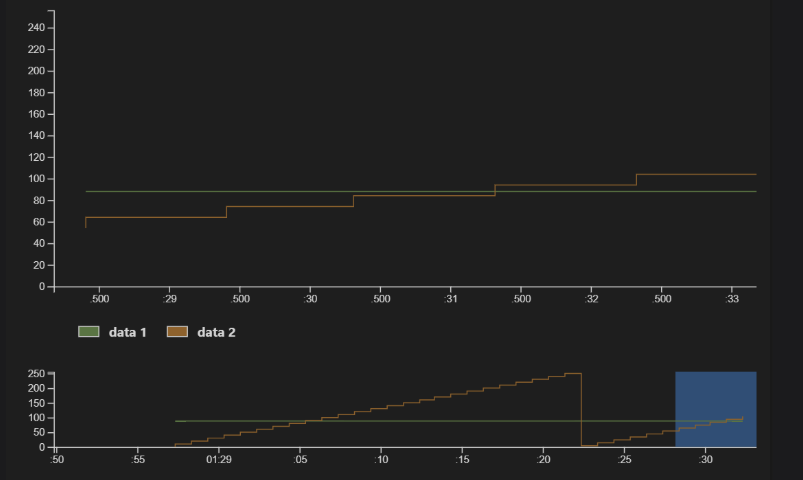
Note that the maximum stable data rate with ST-Link/V2 is about 8kSamp/s for uint8 data, the implementation of the Graph however does limit the data rate even further. The graph will skip samples, if the data rate is too high.