VS Code Panel
Overview
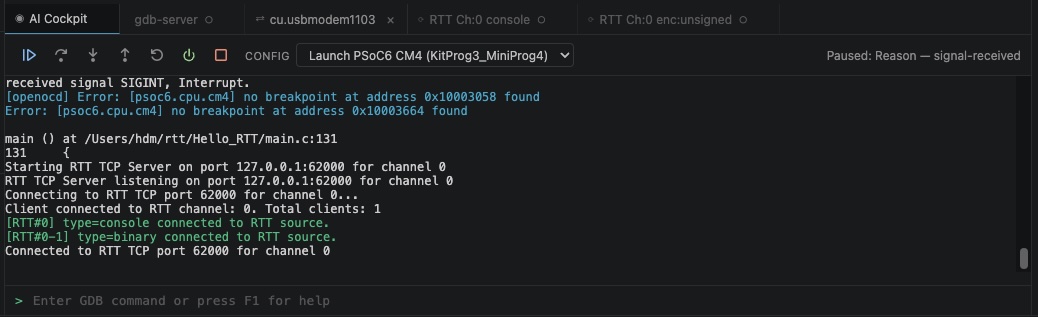
When the CLI session driver runs inside VS Code, output is displayed in the AI Cockpit panel — a WebviewPanel that provides the full TUI experience within VS Code without requiring a separate terminal window.
The AI Cockpit panel uses xterm.js for terminal rendering, giving it the same ANSI color and formatting support as a real terminal emulator.
Features
- Full xterm.js rendering: ANSI color codes, cursor control, and Unicode all work correctly
- Source-tagged output with color coding: each output source (
[RTT#0],[UART:label],[GDB]) has its own color - Toolbar buttons: quick access to common actions — pause, continue, reset, stop session
- Configuration selector dropdown: switch configurations without editing
launch.json - Session status indicator: shows the current state (running, halted, disconnected)
- GDB command input line: type GDB commands at the bottom of the panel
Accessing the Panel
The AI Cockpit panel opens automatically when you start a CLI session from within VS Code. It appears in the panel area alongside Terminal, Output, and Problems.
You can also open it from the Command Palette:
mcu-debug: Open AI Cockpit
Or by clicking the mcu-debug icon in the VS Code Activity Bar.
Hybrid Mode with AI
The AI Cockpit panel is designed for hybrid AI+human debugging:
- The panel shows the live debug stream
- You work with your AI assistant in the Claude Code / Copilot chat panel
- The AI sends commands via
mcu-debug attach(in terminal mode) - Both you and the AI see all output
The panel has a USER-REQUEST button that prefixes your message with the USER-REQUEST: tag that AI tools recognize as physical-world context.
Panel vs Terminal
| AI Cockpit Panel | VS Code Terminal | |
|---|---|---|
| Color support | Full xterm.js | Full |
| Toolbar | Yes | No |
| Status indicator | Yes | No |
| Config selector | Yes | No |
| Integrated with AI | Yes | Manual |
| Scrollback | Unlimited | Unlimited |